As I turned off the postgame coverage of Monday night’s dramatic National Championship game, two thoughts coursed through my veins. First, what a gut-wrenching, sickening, unbearable series of mistakes and failures by Houston to snatch defeat from the jaws of victory.
Second, I wonder when KenPom will add that game’s data to his site.
While the KenPom rankings aren’t a perfect measure of team performance, they’re the closest thing we have, and thus have become a ranking of record. While I could’ve PowerQuery’d the site a week ago without losing much in terms of the whole season, I wanted to wait until the dataset was complete. With Emmanuel Sharp failing to repeat his pump-fake heroics from the Final Four and 6292 games loaded in the database, the rankings of record were ready.
It's a good thing I waited, too. Just like the National Championship game, this competition also came down to the wire. Let me explain.
For the past few seasons, I’ve been one of a select few intrepid souls who dig through each team in college basketball before the year and rank them, all 363 or 364 or 365 depending on the year. The smartest write a computer algorithm to do the hard work, but there’s a couple humans who do it by hand. Actually, I’m fairly sure it’s just Sports Illustrated’s Kevin Sweeney and myself, at least among those who release publicly. I tried to get Three Man Weave’s rankings to add to the collection, but they clearly must not be proud of how their rankings shaped up, or don’t want to give out their data to random bloggers who cold call them in Instagram DMs. The nerve!
Measuring Up
With KenPom’s final rankings serving as the benchmark for accuracy, preseason rankings can be tested using correlation coefficients. I won’t bore you with the math (I doubt I could explain it), but in this context, 0 is bad and 1 is good. The closer to 1, the closer your preseason rankings match KenPom’s final rankings. Given that KenPom’s final rankings are generated through efficiency margin, a ratio rather than ordinal data, the gaps between teams ranked next to one another aren’t always equal.
For example, the gap between Auburn, at fourth, and Tennessee, in fifth, is as large as that between #109, South Alabama, and #155, Loyola Marymount. To properly assess preseason rankings, I mapped each set to the above distribution. Whatever team you had ranked first, you thought would be just as good as Duke this season. Whoever you had last, you were predicting to be Mississippi Valley State bad. KenPom’s preseason rankings came with their own expected efficiency margin for each team, but I lent those the same estimation since the general flow can vary season to season. Each of the computer predictions come with their own ratio level formula and scales, so this method allowed them to be compared side by side.
Breakpoints
I’ll make no bones about it – my preseason rankings have a strong correlation with KenPom’s preseason rankings. The reason I’m comfortable saying that without jeopardizing my integrity is that they have an even stronger correlation with the version I released before KenPom’s preseason rankings were even out. We’re probably “looking” at a lot of similar factors. There’s enough teams we went in complete opposite directions on to where I don’t feel like there’s much of a reason to worry about groupthink here.
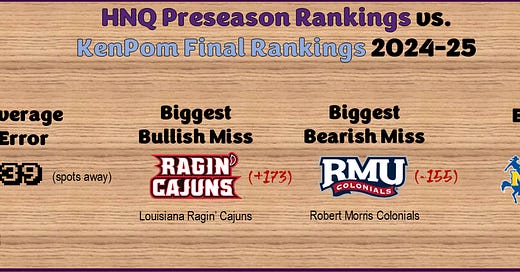
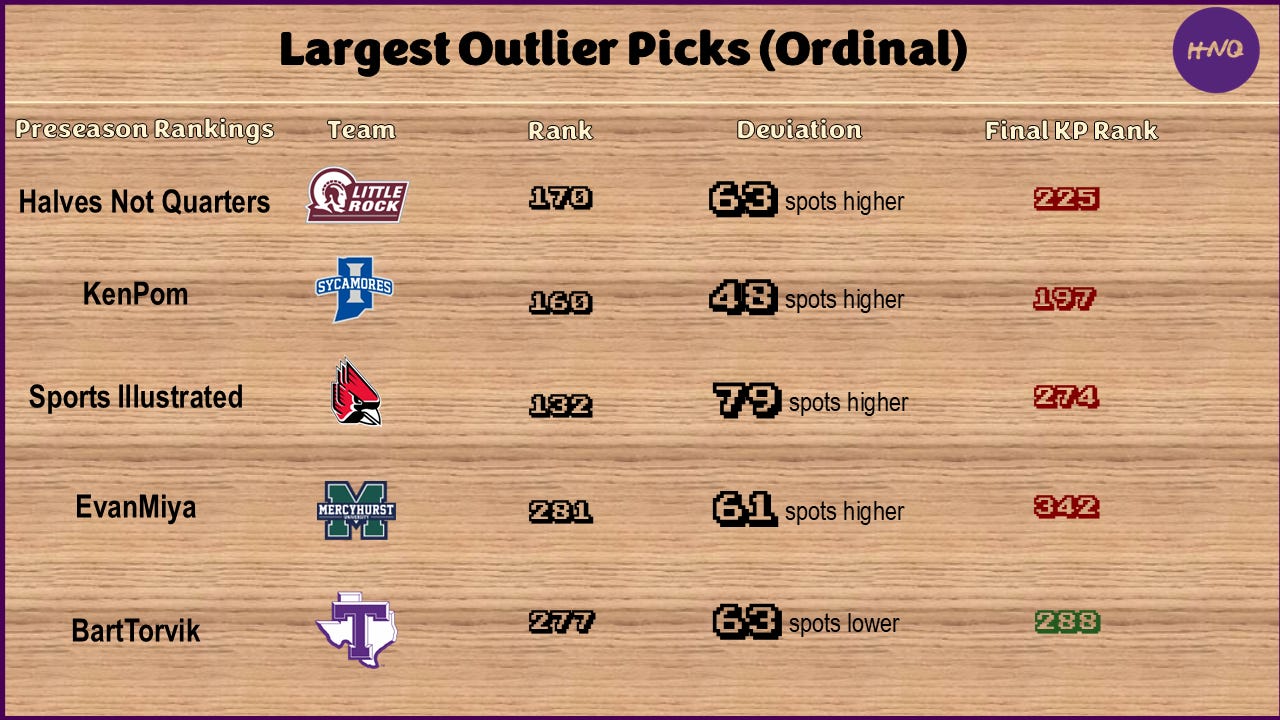
With a core of former power conference contributors in Mwani Wilkinson, KK Robinson, Jonathan Lawson, and Makhel Mitchell, as well as a homegrown star in Jordan Jefferson, I thought the Little Rock Trojans were primed for a dominant run through an Ohio Valley Conference. KenPom didn’t see it quite so. Maybe I wouldn’t have either if I had realized that Makhel Mitchell wasn’t getting an injury redshirt and no longer had any eligibility left. Sports Illustrated’s Kevin Sweeney was thoroughly convinced that Ball State would make some waves in a wide-open MAC behind the return of dominant big man Peyton Sparks. KenPom and I both looked at Sweeney like he was crazy. KenPom’s algorithm couldn’t get enough of Marshall in the Sun Belt, but I wasn’t buying the Thundering Herd, placing them some 30 spots lower. Little did I know how much of an optimist I was, as Kevin Sweeney had them another 90 spots below that. While the rankings tend to approximate each other very well, each team’s unique combination of roster, coach, history, and probably even uniforms for the humans combine to form a sort of Rorschach test for any prospective ranker. Everyone sees something a little different.
Crowning a Champion
With all of this in mind, let’s take a look at how the leading preseason projections shaped up against the rankings of record.

I’m proud to say that, by a whisker which can be entirely explained by variance, I am the proud owner of the most accurate publicly released college basketball preseason rankings in the world by correlation to final KenPom rank. That’s about as niche and asterisked as it gets, but it’s still pretty neat to say that I’m the best in the world at something. It certainly gives me a reason to do it again next year. Clearly, though, the takeaway from the above chart should be that any one of the college basketball experts who go through the trouble of putting these together won’t lead the reader too far astray.
Kevin Sweeney, Sports Illustrated
The first edition of next season’s HNQ preseason rankings will drop around August. Subscribe to Halves Not Quarters to receive them in your inbox when the time comes.


