


Swimming With The Sharks
Taking stock of this season's simulated gambling picks at Halves Not Quarters.
I watched a lot of college basketball this year.

The abomination above is a visualization of how I tracked which teams I had seen play as the season went on. The “CD rack” on the far left is every team in Division I: an orange slice indicates that I saw a few minutes of gameplay from a team, yellow suggests that I watched a substantial amount of a game, and the green indicates the rare chances I had to see a team play live. While I didn’t intentionally set out to watch every team this season, filling in a new notch on the chart was often the tiebreaker I needed when deciding what game to put on.
Another useful decider was whether I had “money” on the game.
Since probably my junior year of high school, I’ve taken an interest in picking “spreads”, deciding if a team will win by more than the expected outcome predicted by bookmakers. While this simply meant tracking my wins and losses in a blank spreadsheet for a few years, with the rise of sports gambling as a legal and popular way to go bankrupt, I’ve evolved my simple hobby into a full-on graphical interface and simulator. Last season, 2022-23, I began tracking a financial element, adding and subtracting from a total based on the outcome of each pick. Standard American odds for point spreads are -110, meaning that a win will net 10 and a loss will net —11, with a bet of $11. In other words, you have to win 11 games for every ten you get wrong just to break even.

This season, I added an additional wrinkle of mandating that I make a pick on every day with a game being played, unless, of course, life intervened. I wanted to push myself to find interesting and unique plays that I might not otherwise analyze on the days with a huge swath of games to pick from, and I also expanded my selection from pure point spreads to more prop bets, including total score of the game and individual player stats.
So, how did it shake out?

While it took some white-knuckling through a difficult December-January stretch, I managed to get my head above water by the start of February and ended the season with a positive total. Had I bet $11 on each pick, I would’ve ended the season with about $50 in my pocket. That paltry total means I certainly don’t have a future career in this, but it does mean that I can swim with the sharks and not get bit. With how many people ruin their lives with this stuff, that’s not something I take lightly.
What I think can be considered impressive here is the volume. Professional gamblers don’t make 764 picks over the course of the season, and they certainly don’t follow an arbitrary rule that they must make a pick for every day with a game. Over this volume, had it gone 50-50 on my picks betting $11 on each, I would’ve ended the season $382 in the hole. Suddenly, my fake $50 is starting to sound pretty nice.
Slates & Candlesticks
You might notice that some of the dots on the chart above go directly vertical. That indicates days with multiple picks.
I was curious whether days with just a single pick or two led to a higher accuracy, given I was spending more time on each decision, as opposed to major Saturday or Tuesday slates with, in some cases, over one hundred matchups to choose from. To analyze these major slates first, I borrowed a technique from stockbrokers, breaking the activity of those days into an opening total, a closing total, a high total, and a low total to create a candlestick graph. While there are simpler ways to compare whether my profit rate was based purely on the volume of picks in a given day, the sweet visualization was too hard to resist.
I’ll use my picks on January 11th as an example of what I mean.

While I was deep in the negatives at this point in the season, the green box represents the amount my profit rose over the course of the day. After opening at -131 units (dollars, if you’d like) with Towson’s 73-64 win over Stony Brook, I fell back down to a daily low -142 units when Delaware won a narrow 68-62 victory over Campbell, just one point short of pushing the spread. After a nice winning streak through the middle of the day, I reached a high profit mark of -83 units with Utah Tech pulling off a 75-70 upset of WAC foe Stephen F. Austin. A handful of losses closed out the slate, but I recovered some profit and ended the day up 25 units from where I started once San Francisco blew out San Diego 83-63.
Here’s the full graph of each day with five or more picks.
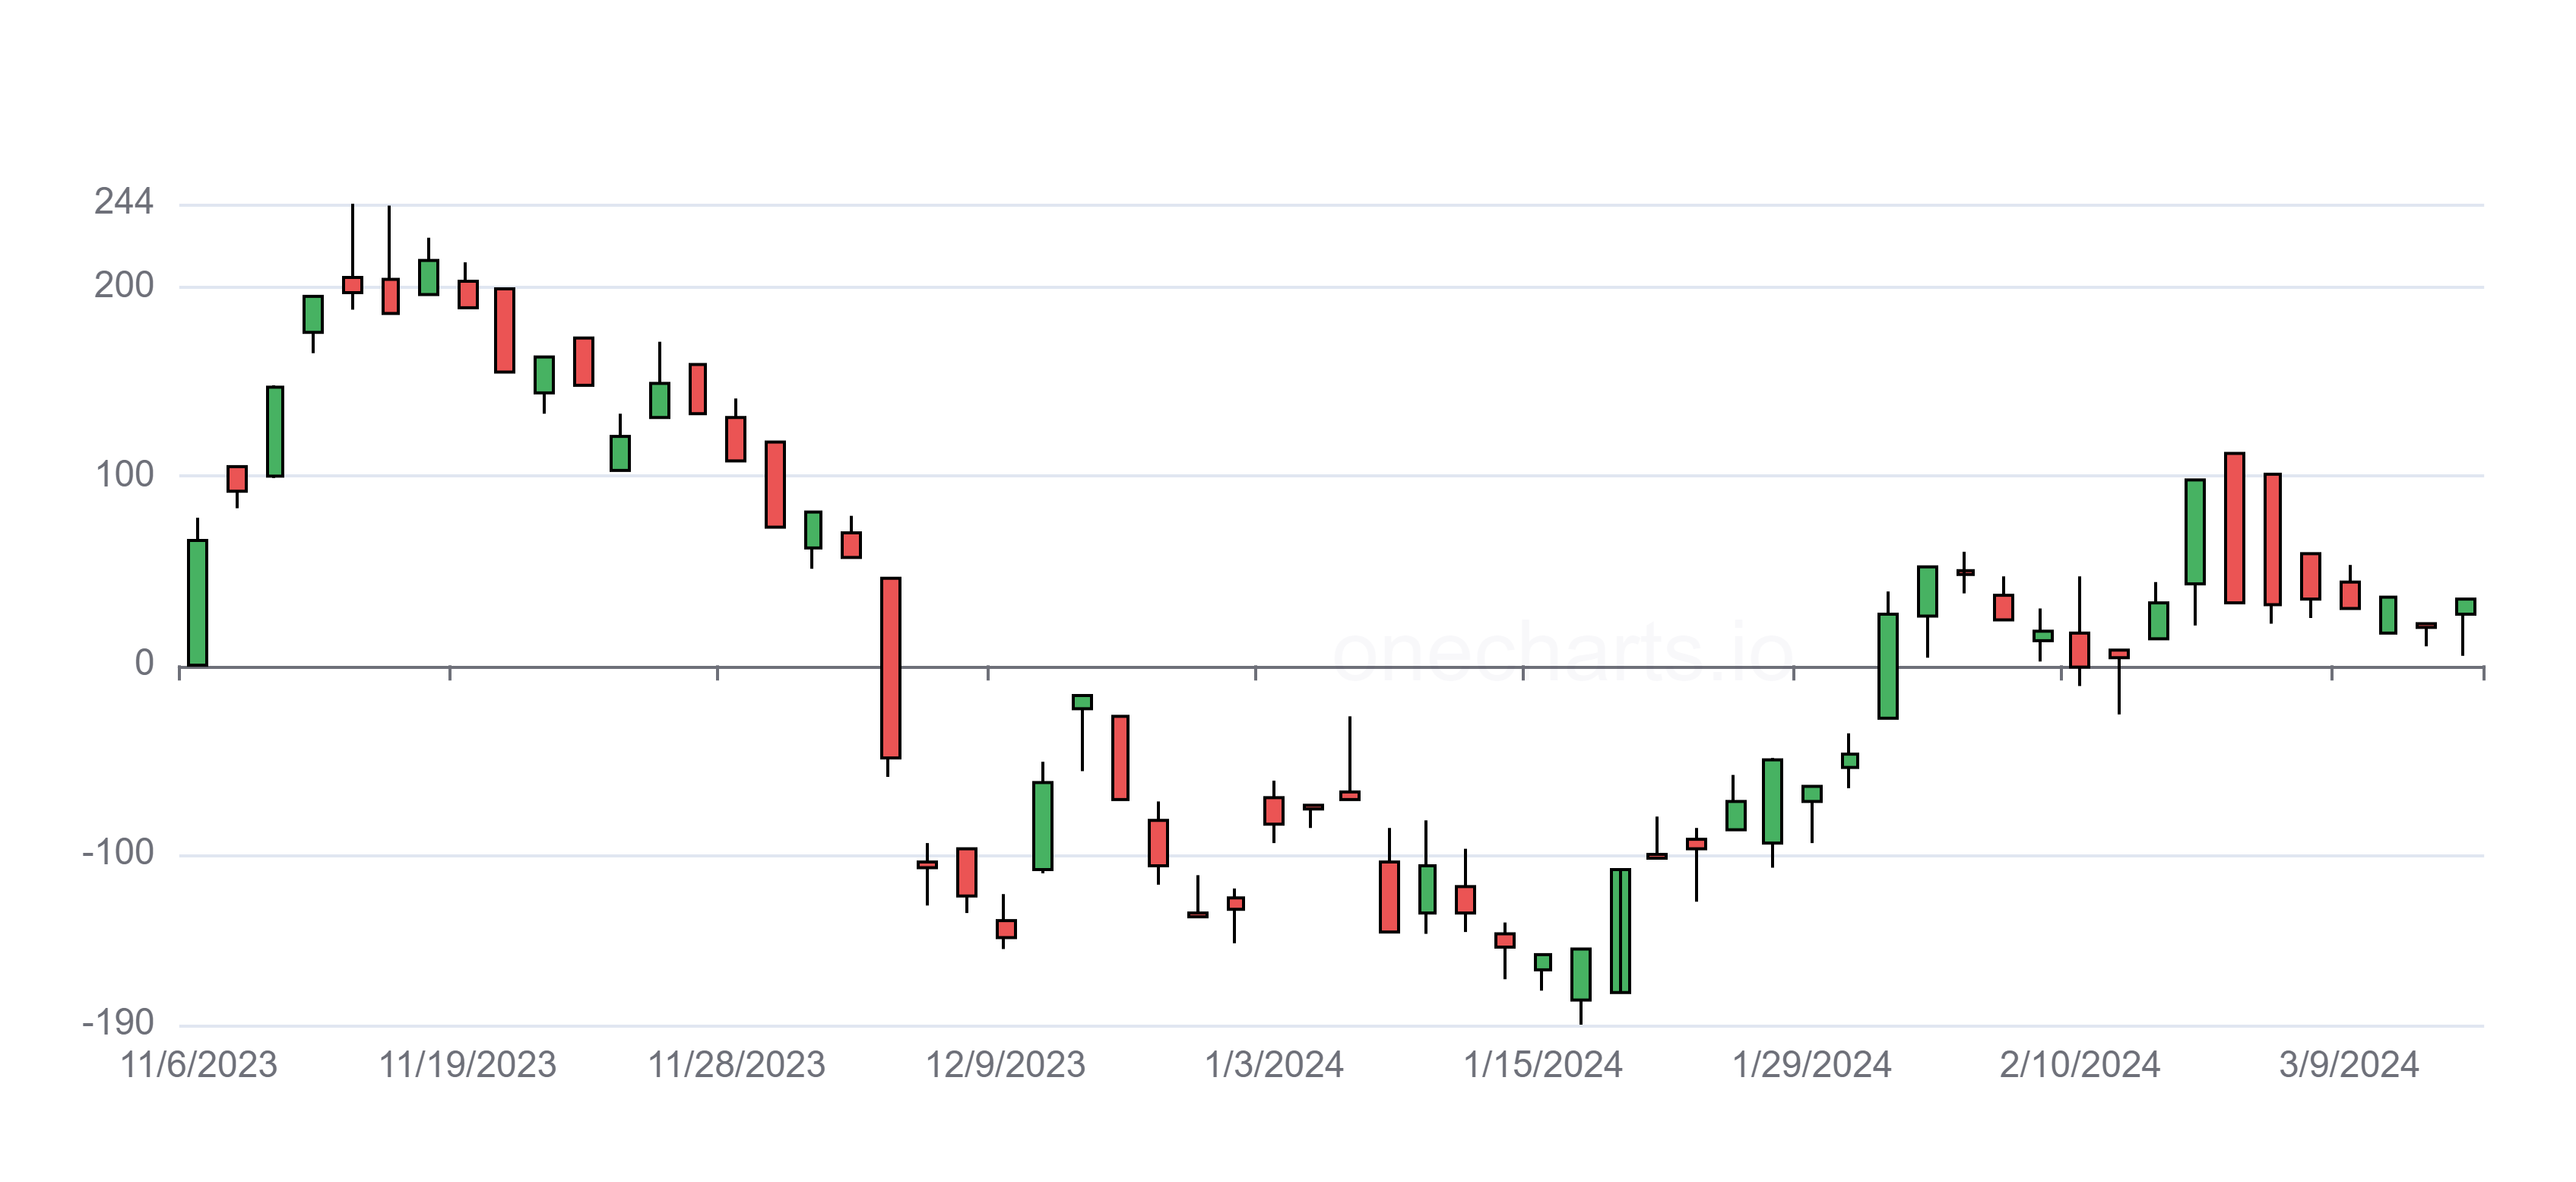
To the naked eye, it’s not be immediately clear what the implications are here. There’s a lot of red, and a lot of green, but when subtracting opening figures from closing marks, major slates of five or more games were a net negative of 84 units for my picks this season. Since I finished with a profit of 49 units, that represents a significant drain on my hypothetical financial resources. I might need to reel it in next season when it comes to the days with enough games to crash the ESPN scoreboard.
Miscellaneous Marks
How about those unusual picks where I went for prop bets rather than regular point spreads?

Much to my surprise, it turns out I’m half decent at deciding whether a game will go over the expected total points for both teams combined. While guessing what individual players would do turned out to be a bit of a crapshoot, over/under bets will be something that I look to test increased volume in next season; it’s possible that my stellar record is simply driven by that low volume, as I may only grab over/unders when there is a stark inefficiency that jumps off the page.
Back To The Futures
In addition to my picks throughout the season, I also gambled some of my hypothetical fortune on predicting regular season conference champions before the season. Here’s how that went:

With payouts based on the same 11-unit stake as each in-season pick, I managed to pick up another 53 units from conference championship futures, as Loyola Chicago and Eastern Washington each won their respective leagues despite facing heavy favorites. Colorado State and Illinois each had impressive seasons but failed to best their conference rivals, and we won’t talk about Arkansas.
Rising to the Occasion
Throughout the season, I also tracked games with unusual circumstances, such as preseason and postseason tournaments, to see how unique settings affected my ability to spot value in the market.

With my December swoon evenly split between noncon and early conference play, neither of the major categories of volume gained ground on the other. Between all types of tournament play, I performed best in postseason play and worst in noncon and conference tournaments. With the NCAA Tournament drawing a more casual audience to college basketball, I believe that I was able to take advantage of more “retail bettors” moving lines in favorable directions for those in the know. With this knowledge, I’ll be more wary about picking non-postseason tournament games where only the sharpest of sharks circle the waters.
Conference Correlations
In a future piece I’ll address why conferences aren’t something I’ll consider a real part of high-major college basketball going forward, but, for now, I have some data on my picks split up by league. There wasn’t any meaningful correlation between my win rate and the volume of picks I had per league, which lends credence to the idea that I don’t really know what I’m doing.

When weighting my win percentage by the volume of picks, the Big Ten came out as my best conference, as that .56 went a long way over the course of an outlier 25 picks. With no incentive for volume, however, a more measured SoCon campaign was the real feather in my cap. Despite my reporting from the conference tournament, clearly the ACC wasn’t for me this year. Luckily, the league as we know it won’t exist next season. You’re welcome, college basketball fans. It was my idea after seeing this chart.
